Tom Davenport, a visiting professor of business at Harvard contacted us last summer about a new book he’s finishing: Keeping Up with the Quants. The book will be an accessible review of when and how to use quantitative analysis to help improve your decision making.
We read the book and made suggestions as to where topics could be better understood through the use of visual communications. Since visualizing data is a key recommendation for improved decision making, we felt it was important to make the content as accessible as possible.
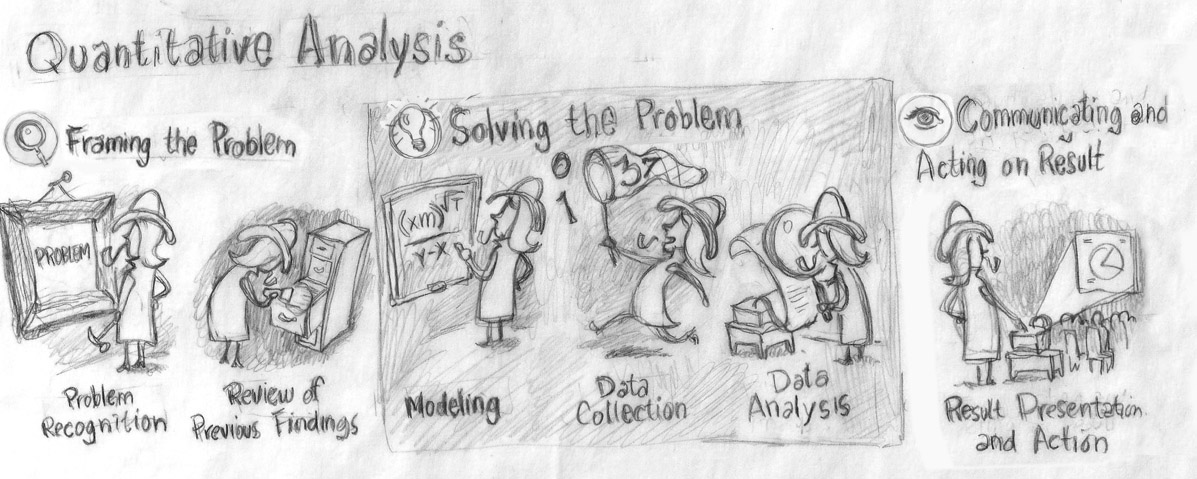
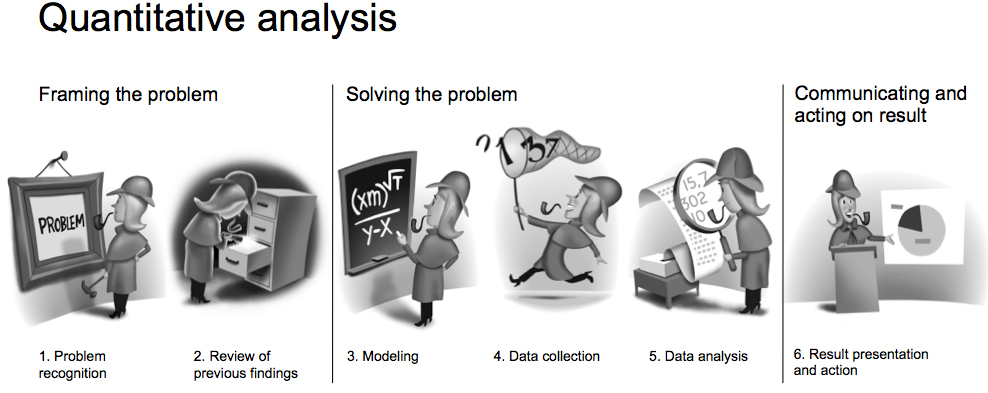
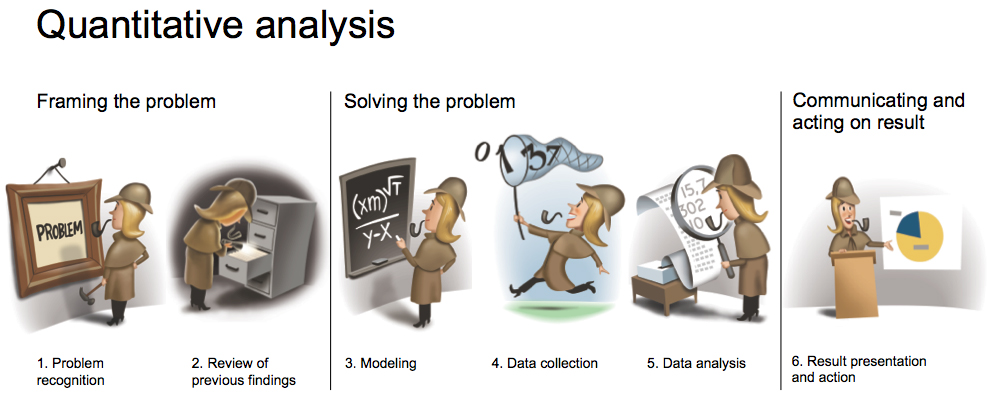
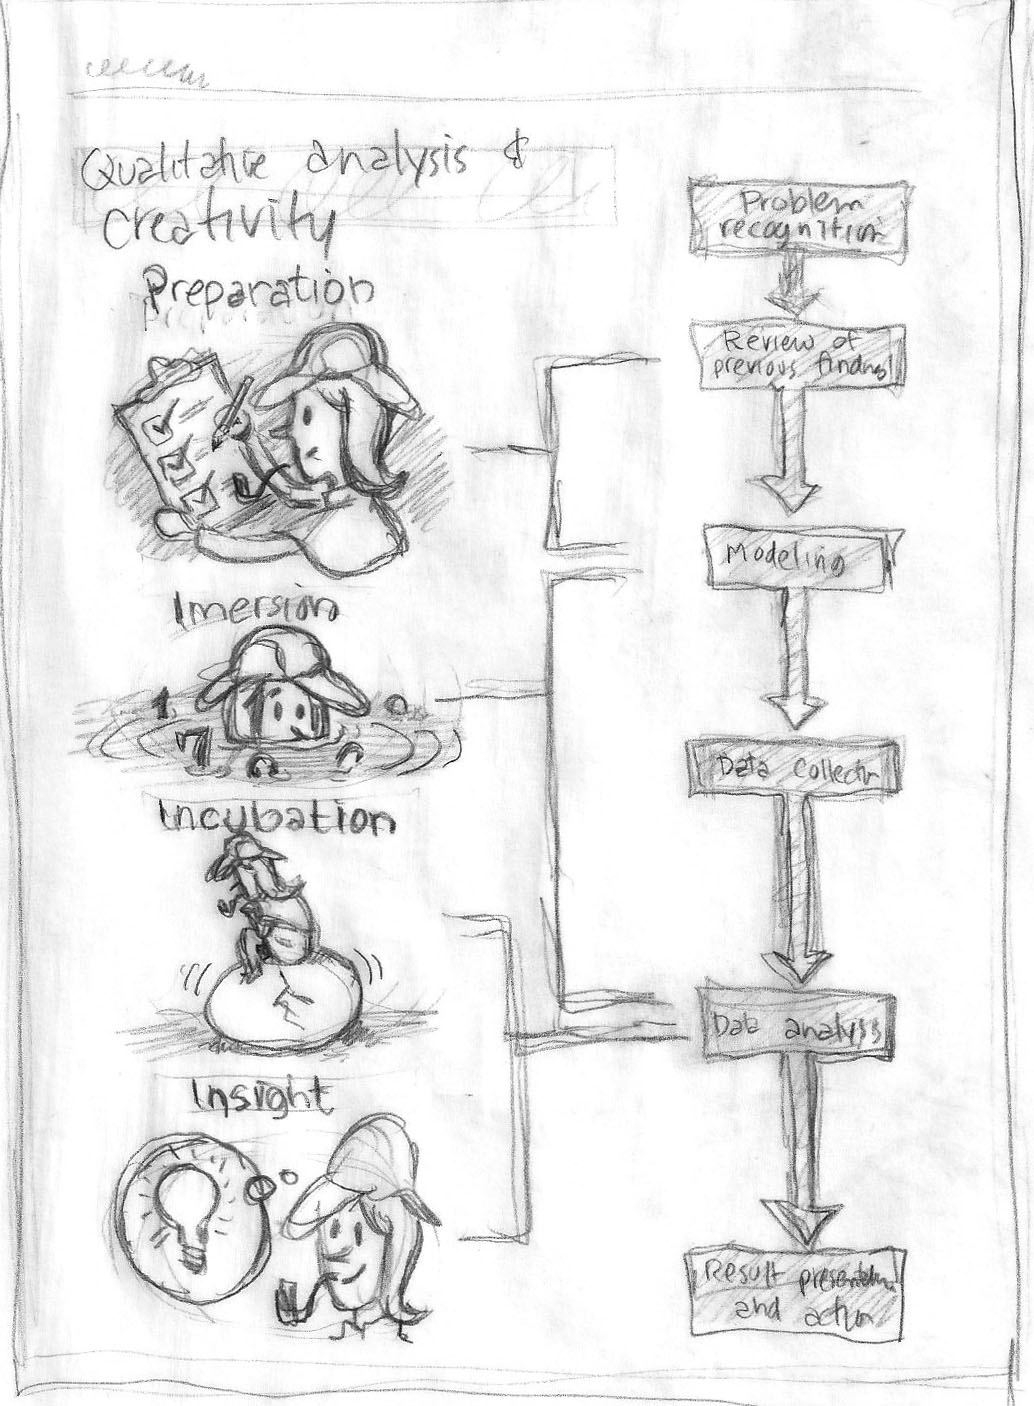
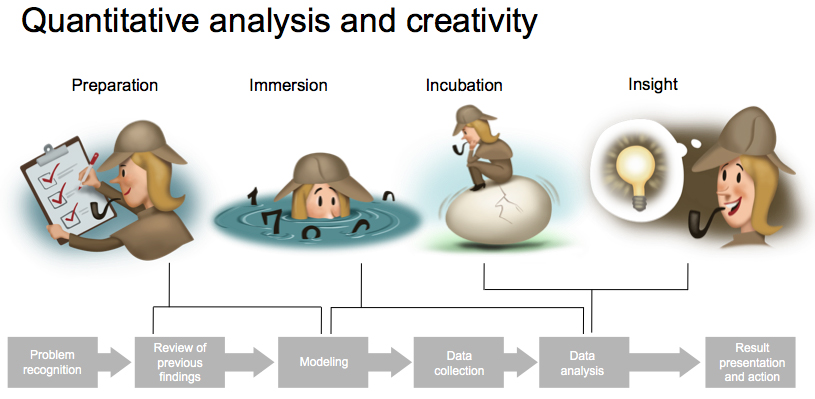
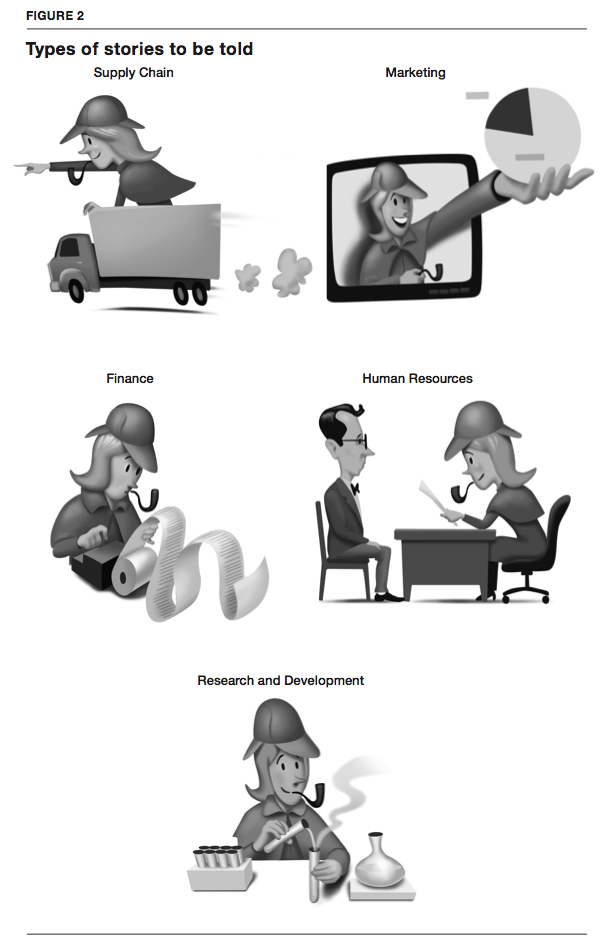
Here are a few of the images from Tom’s upcoming book, to be released in the summer of 2013. I’ve included some of the development sketches. Although the illustrations will be published in B/W, we finished them in color for PPT and other creative uses.